Project Overview
This project involves creating interactive dashboards to analyze coffee shop data, focusing on sales trends, customer preferences, and operational performance. By leveraging dynamic dashboards, the project provides actionable insights to optimize strategies and improve overall business performance.
Key Outcomes
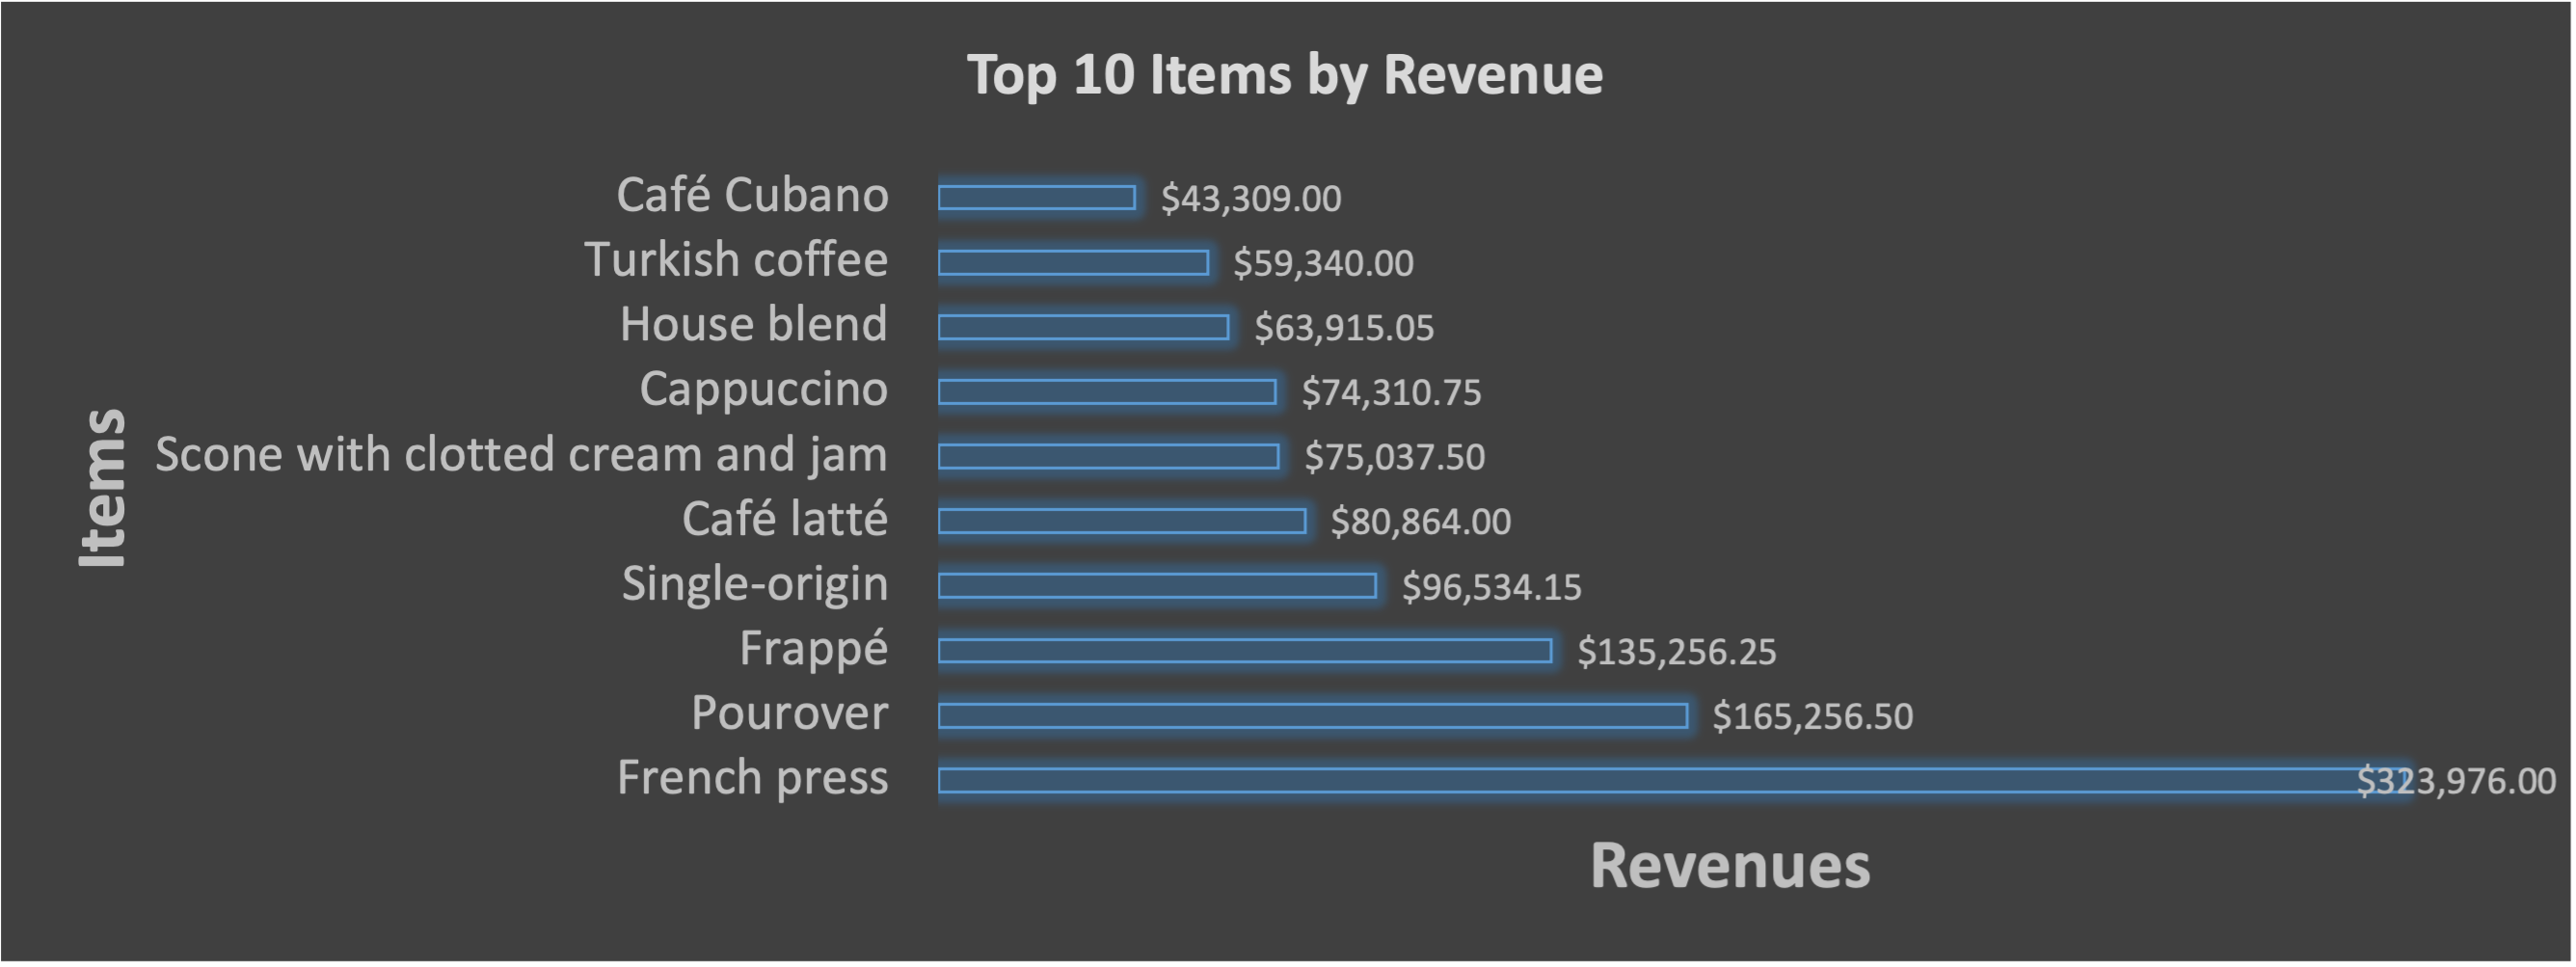
- Identified key sales trends and peak revenue periods.
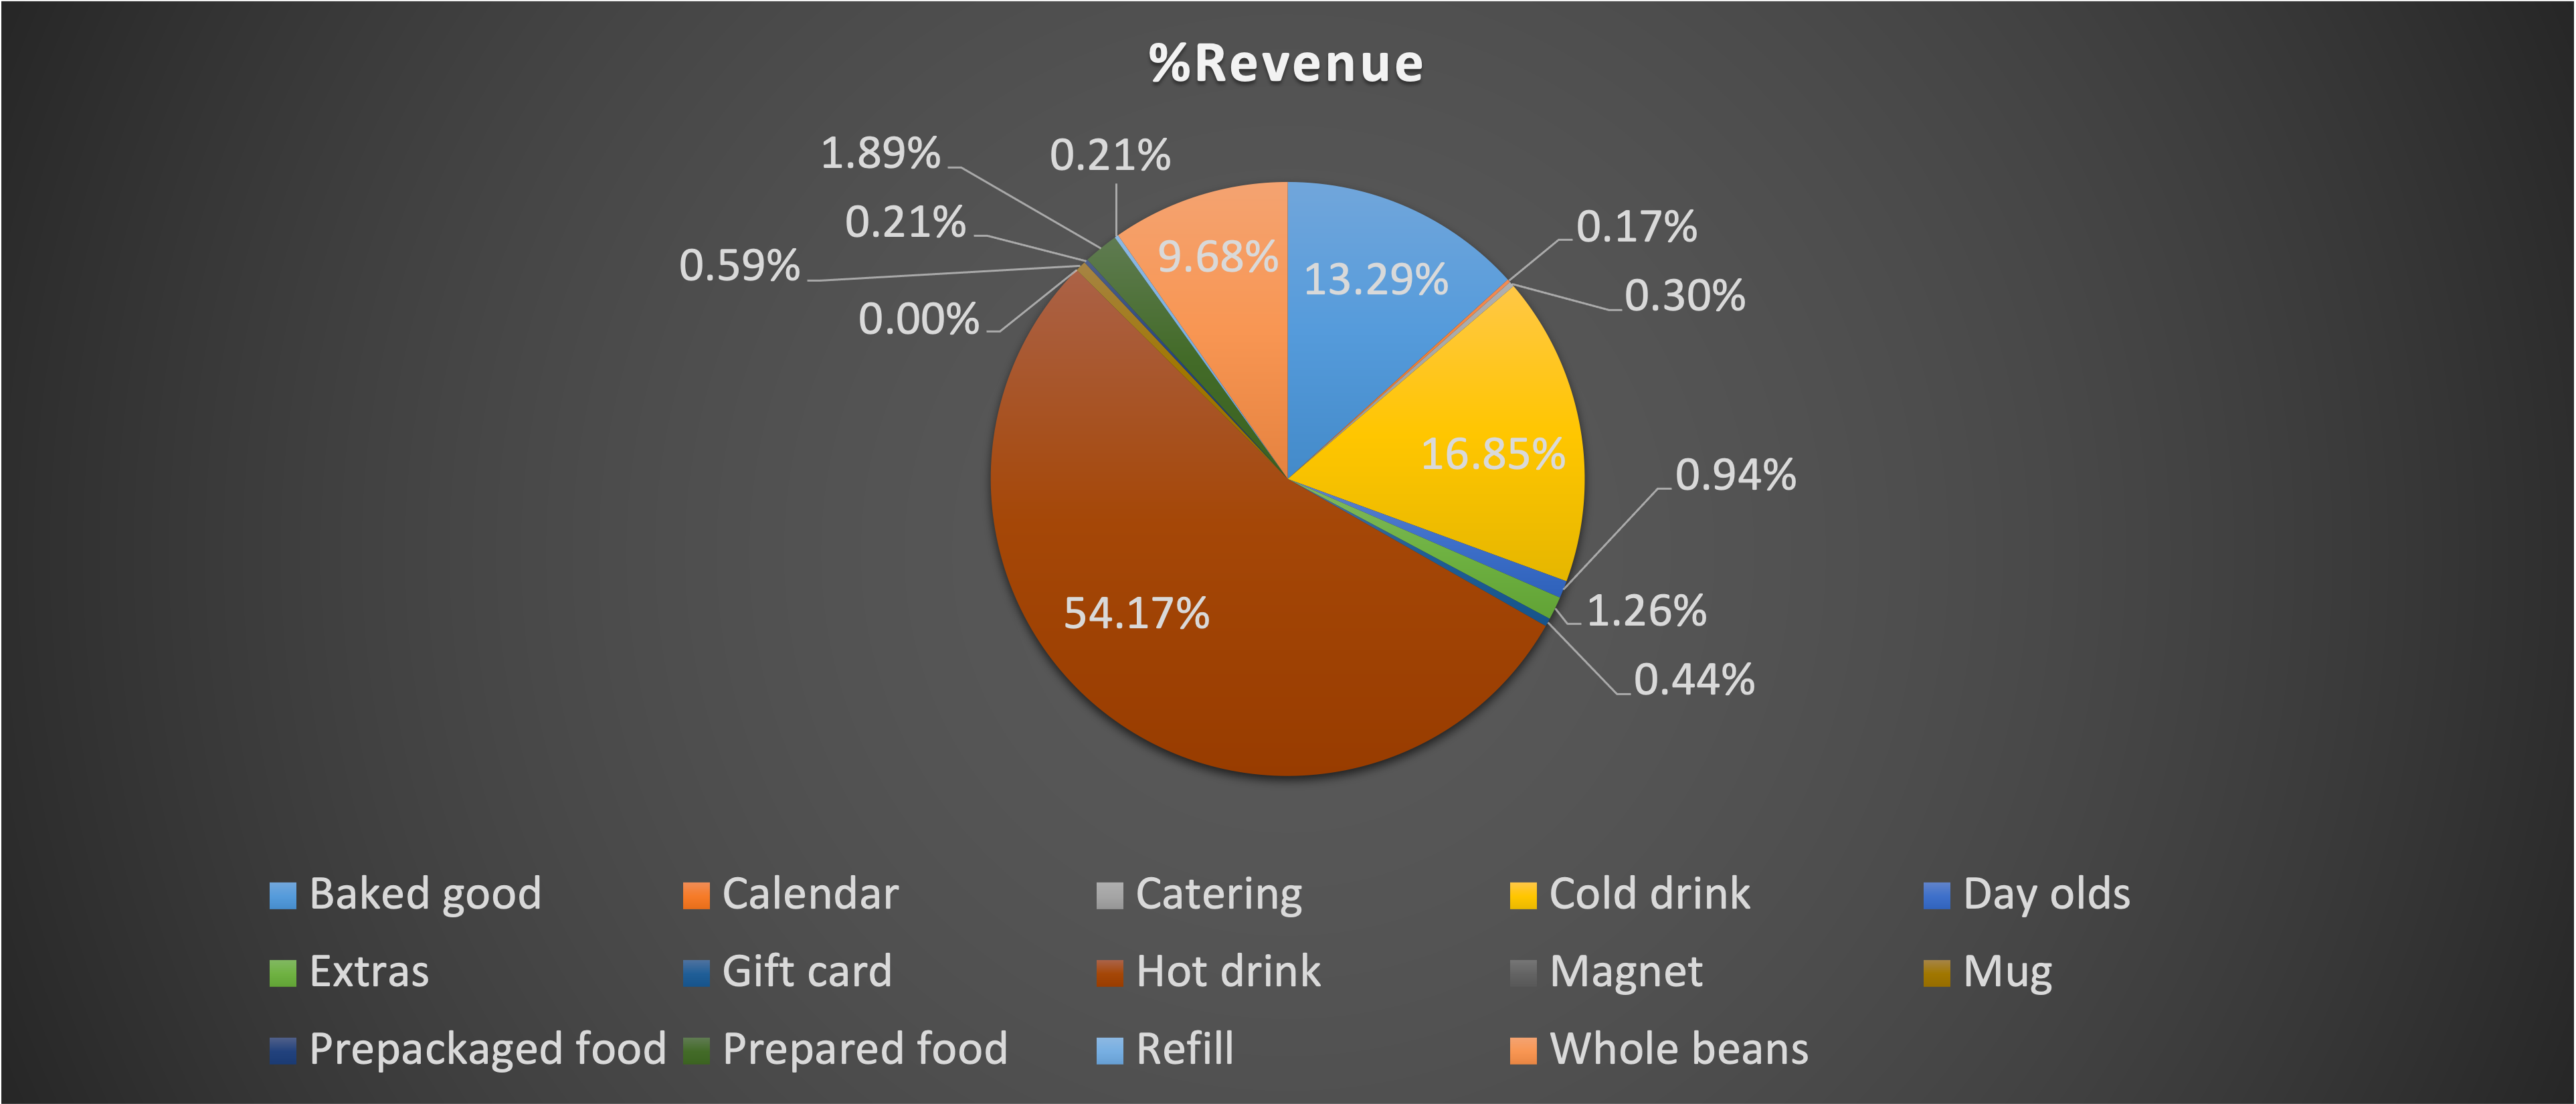
- Enhanced visibility into customer preferences and purchasing patterns.
- Streamlined operational reporting for better resource allocation.
Tools Used
- Microsoft Excel
- Power Query
- Power Pivot
- Pivot Tables and Charts